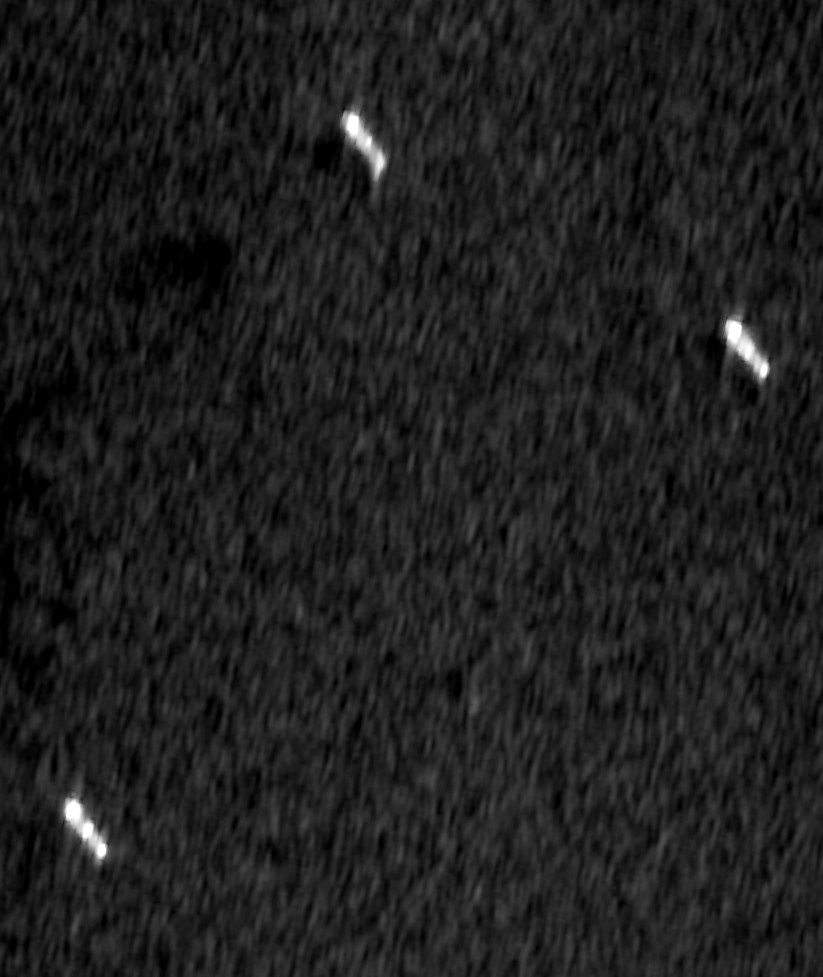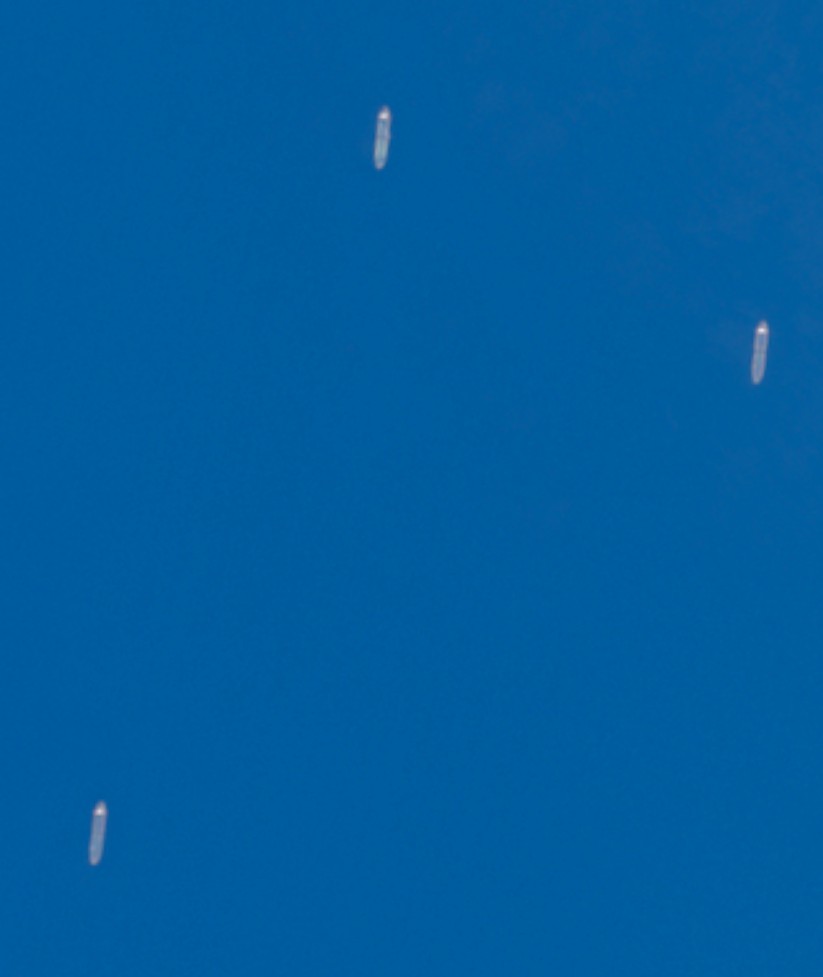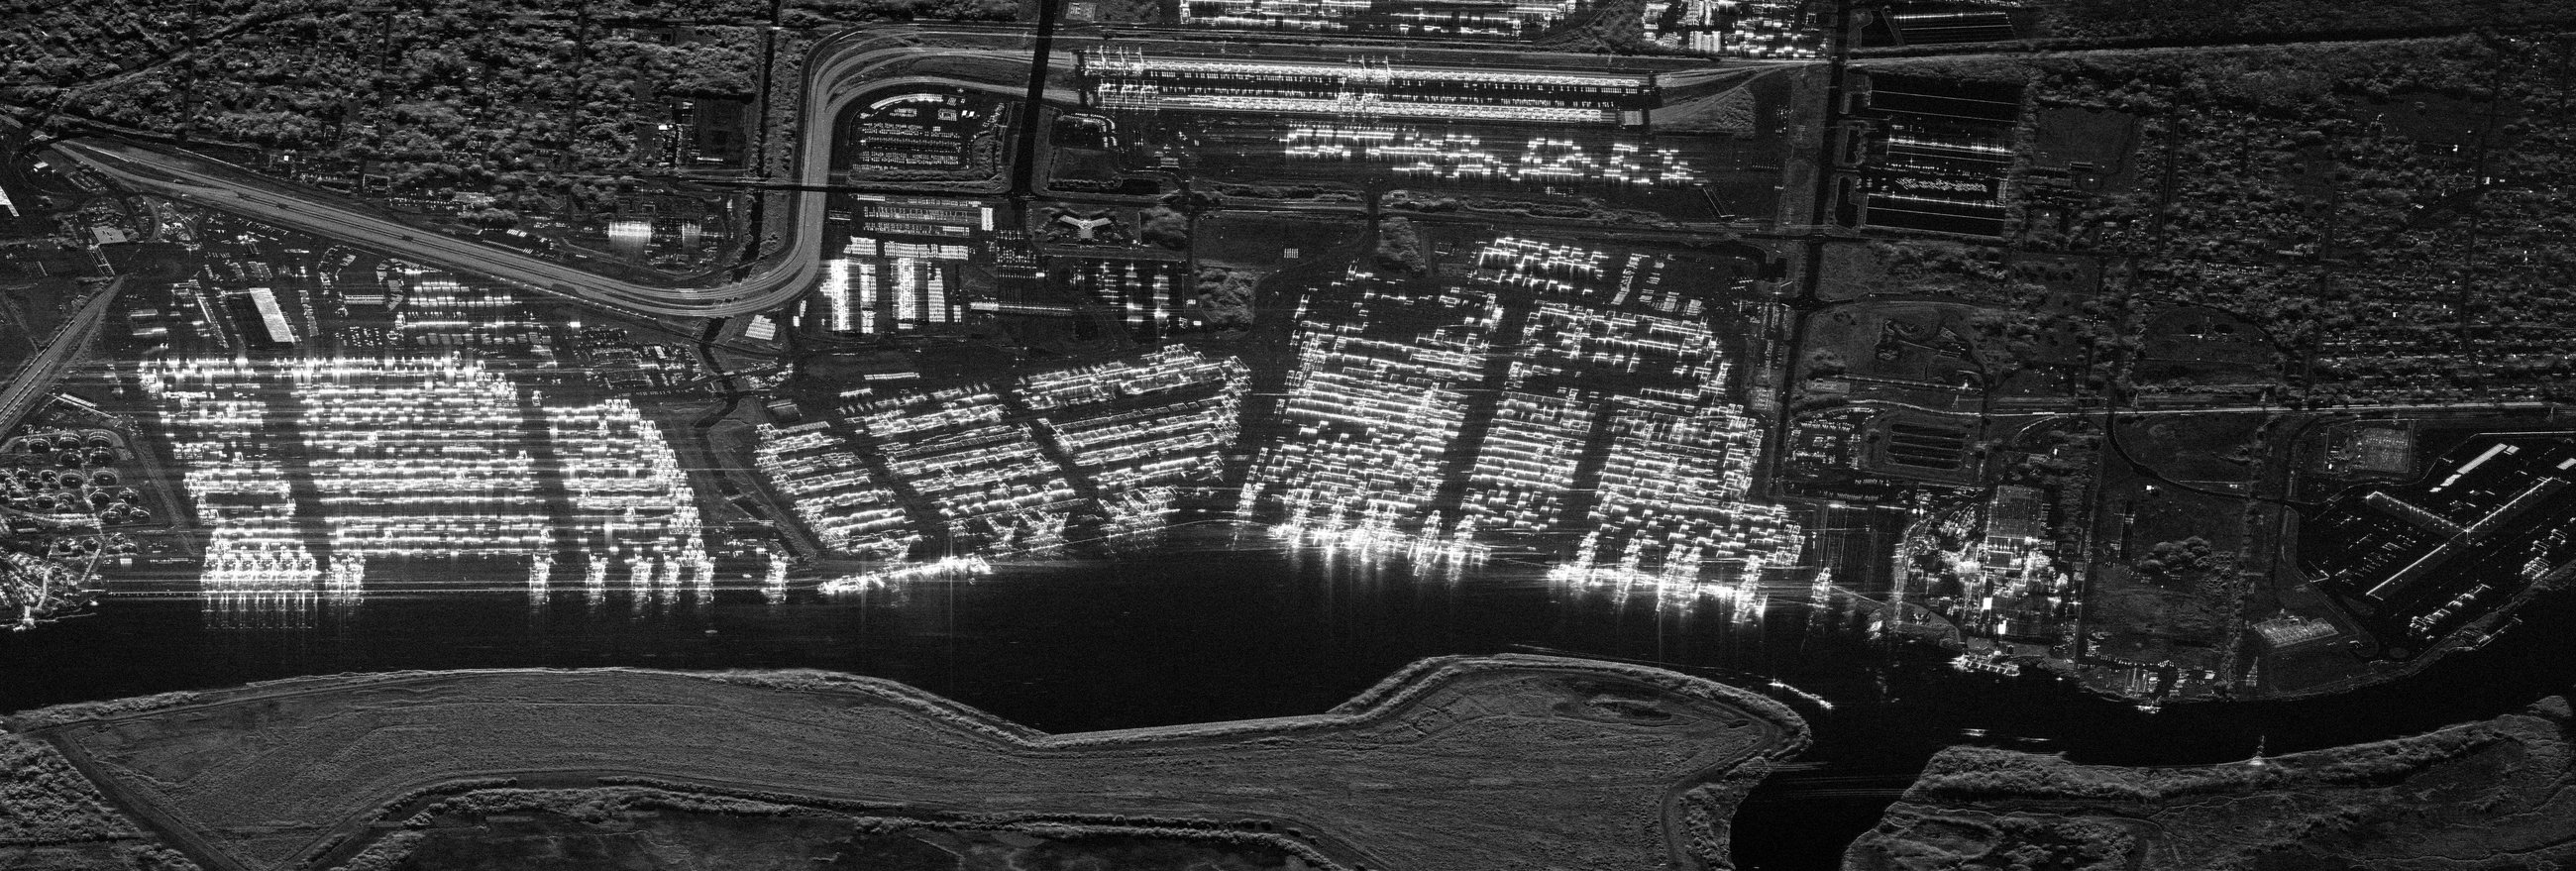
Fig. 01
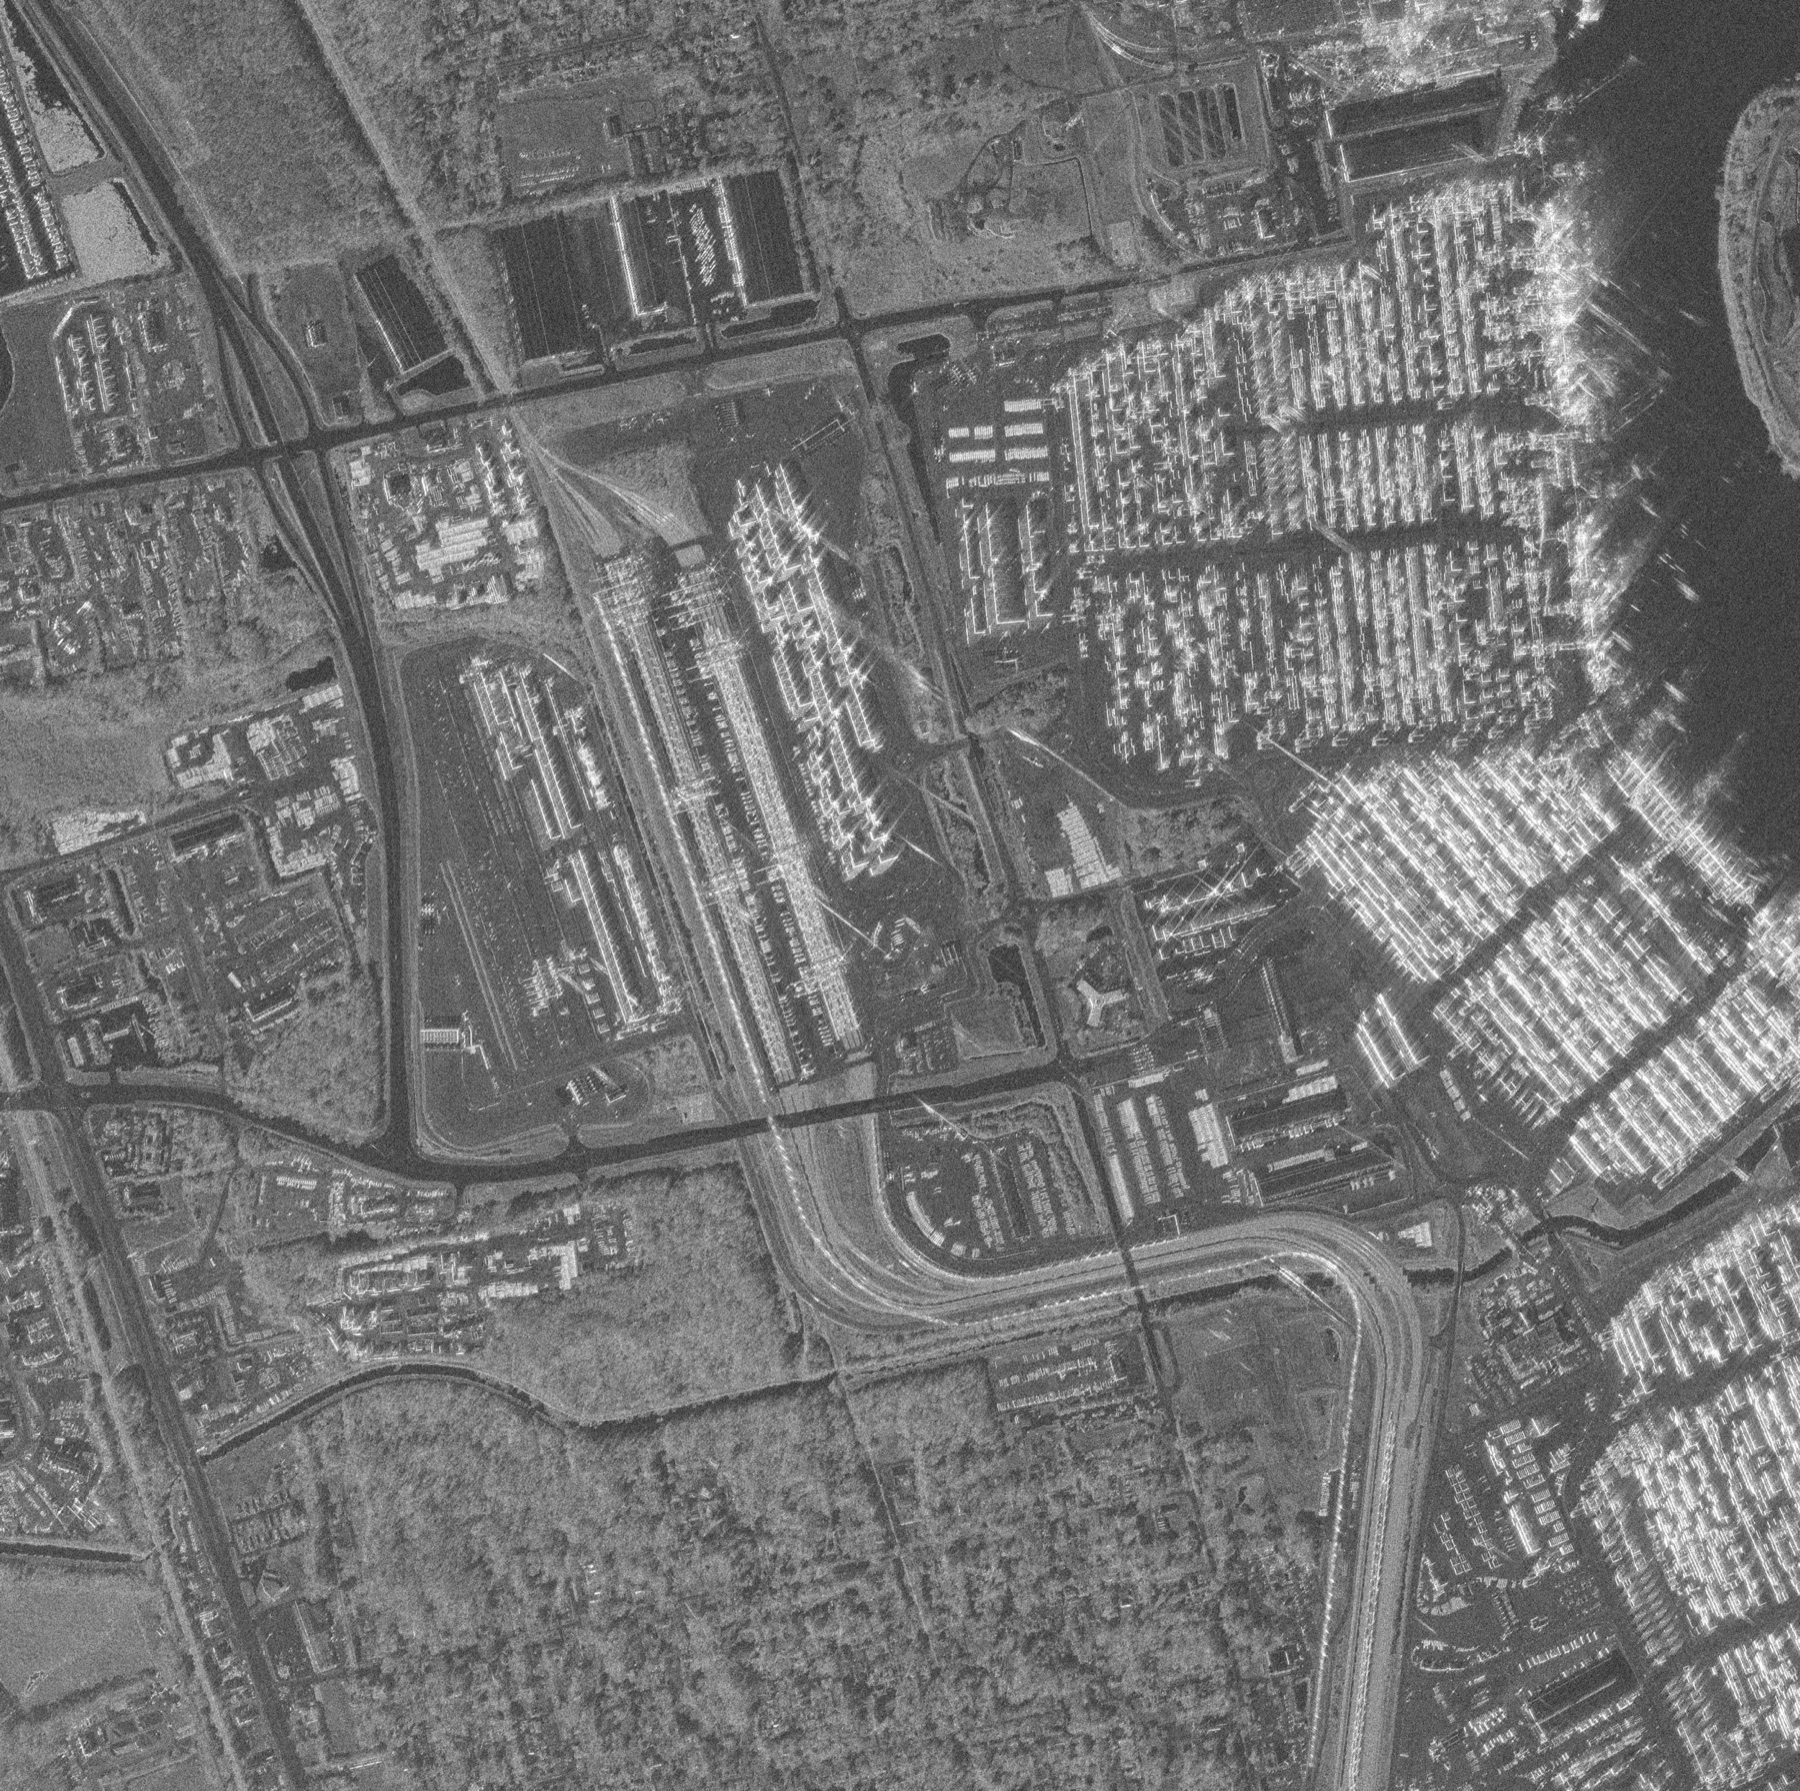
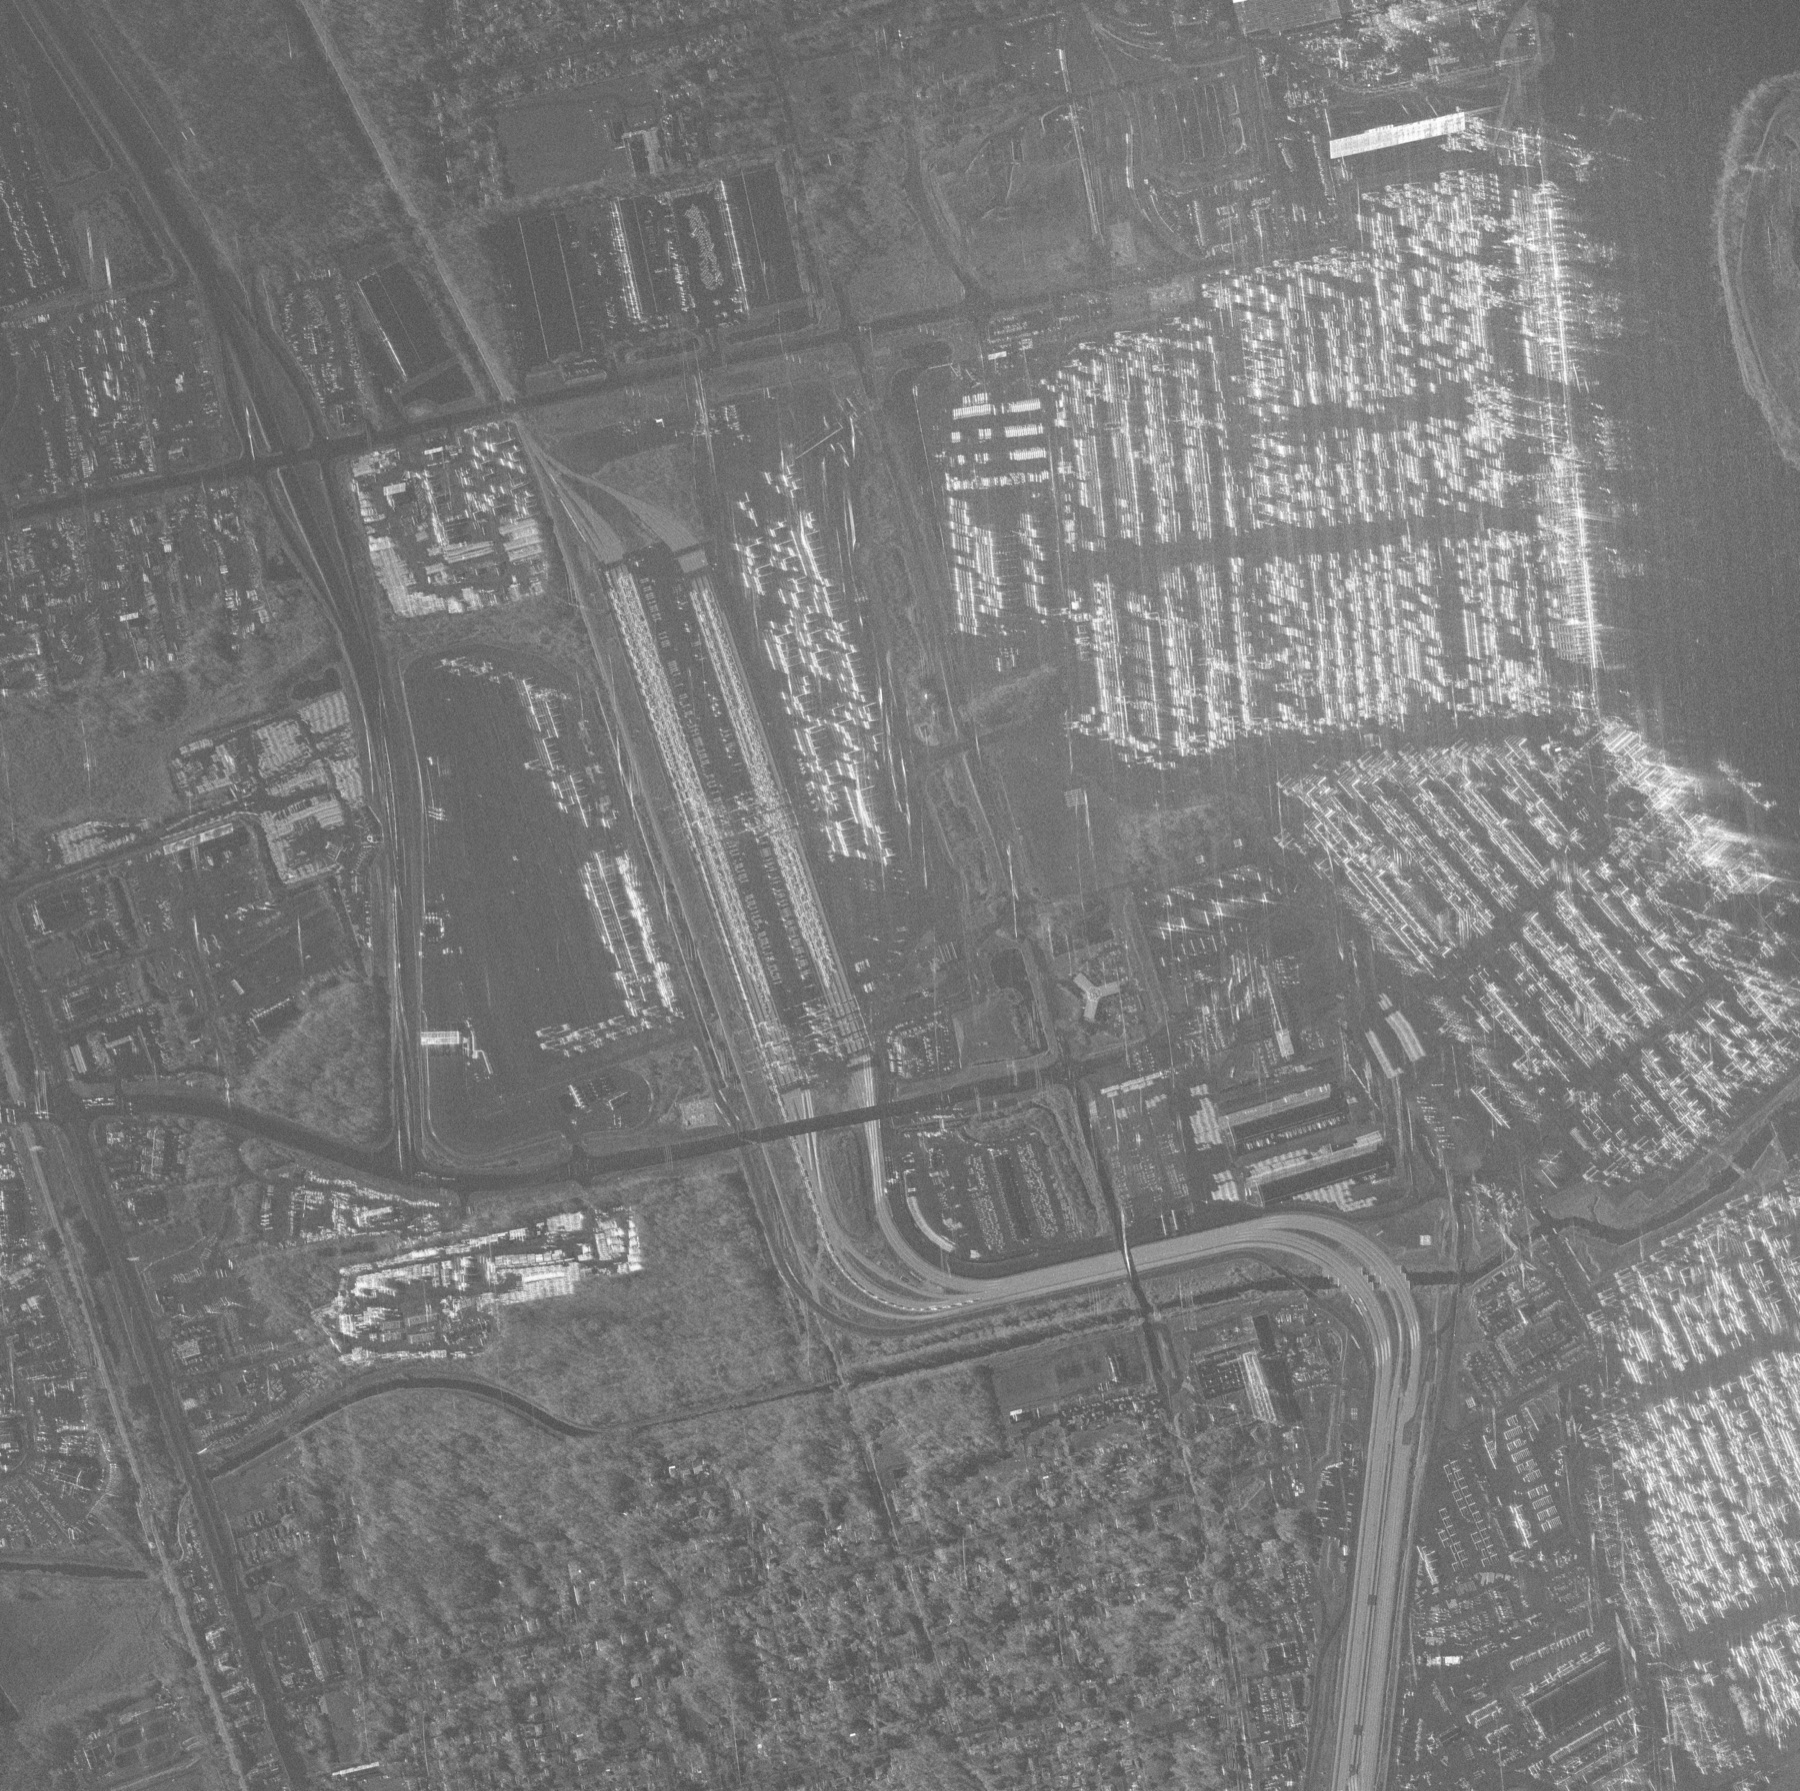
Full-spectrum scene over the Port of Savannah
“What can satellite data tell us about a single port, this week, last month, and last year, without waiting on an analyst?”
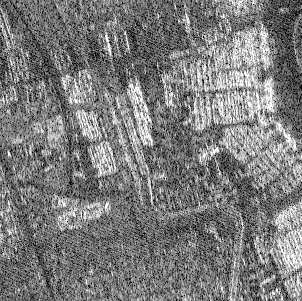
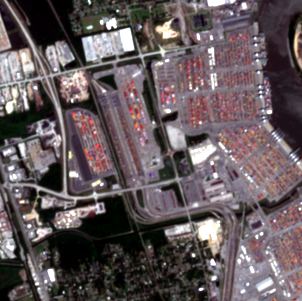
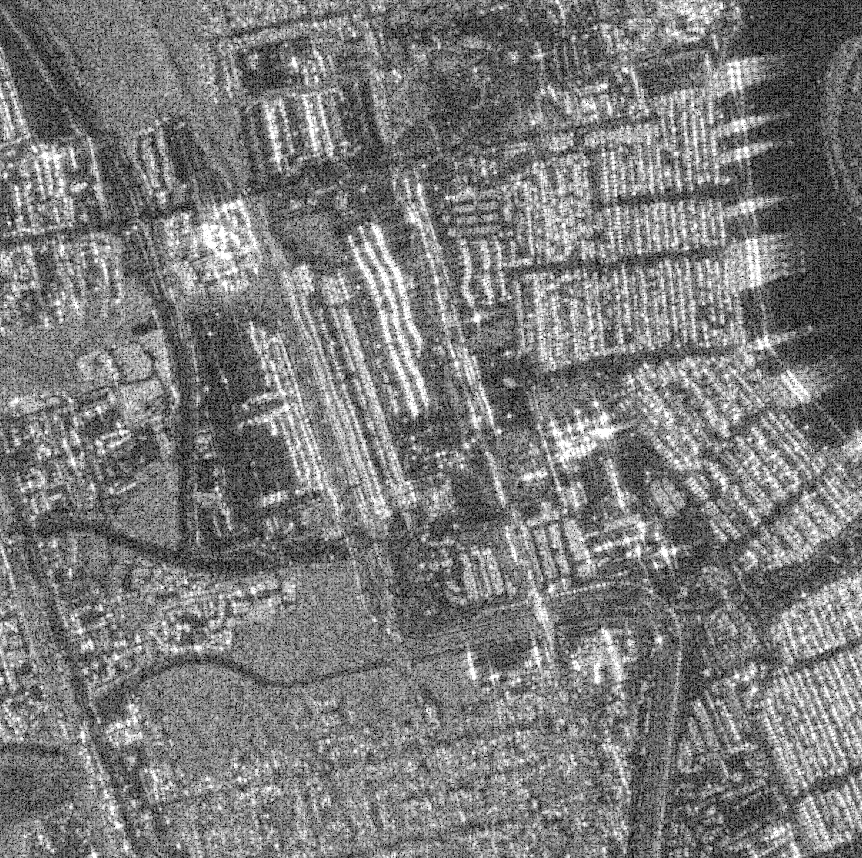
Most providers show you one image from one sensor. Here the same square mile of port is seen five different ways, high-detail radar, all-weather radar, and optical, drawn from open archives and registered to one common footprint. Click any panel to see it full size.
- What the figure shows
- The same cut of the Port of Savannah seen by five sensors, radar and optical, each brought onto one common footprint so the panels can be read against one another.
- Industries
- Maritime & ports · Defense & intelligence · Infrastructure & energy · Insurance & risk
- Provenance
- Multi-sensor, Capella · Umbra · Sentinel-1 · Sentinel-2 · NISAR · Port of Savannah, Georgia, USA · Public open-data archive
- Caveat
- Every image here comes from a public open-data archive. The same workflow can run on tasked or proprietary imagery under NDA.
Guided tour
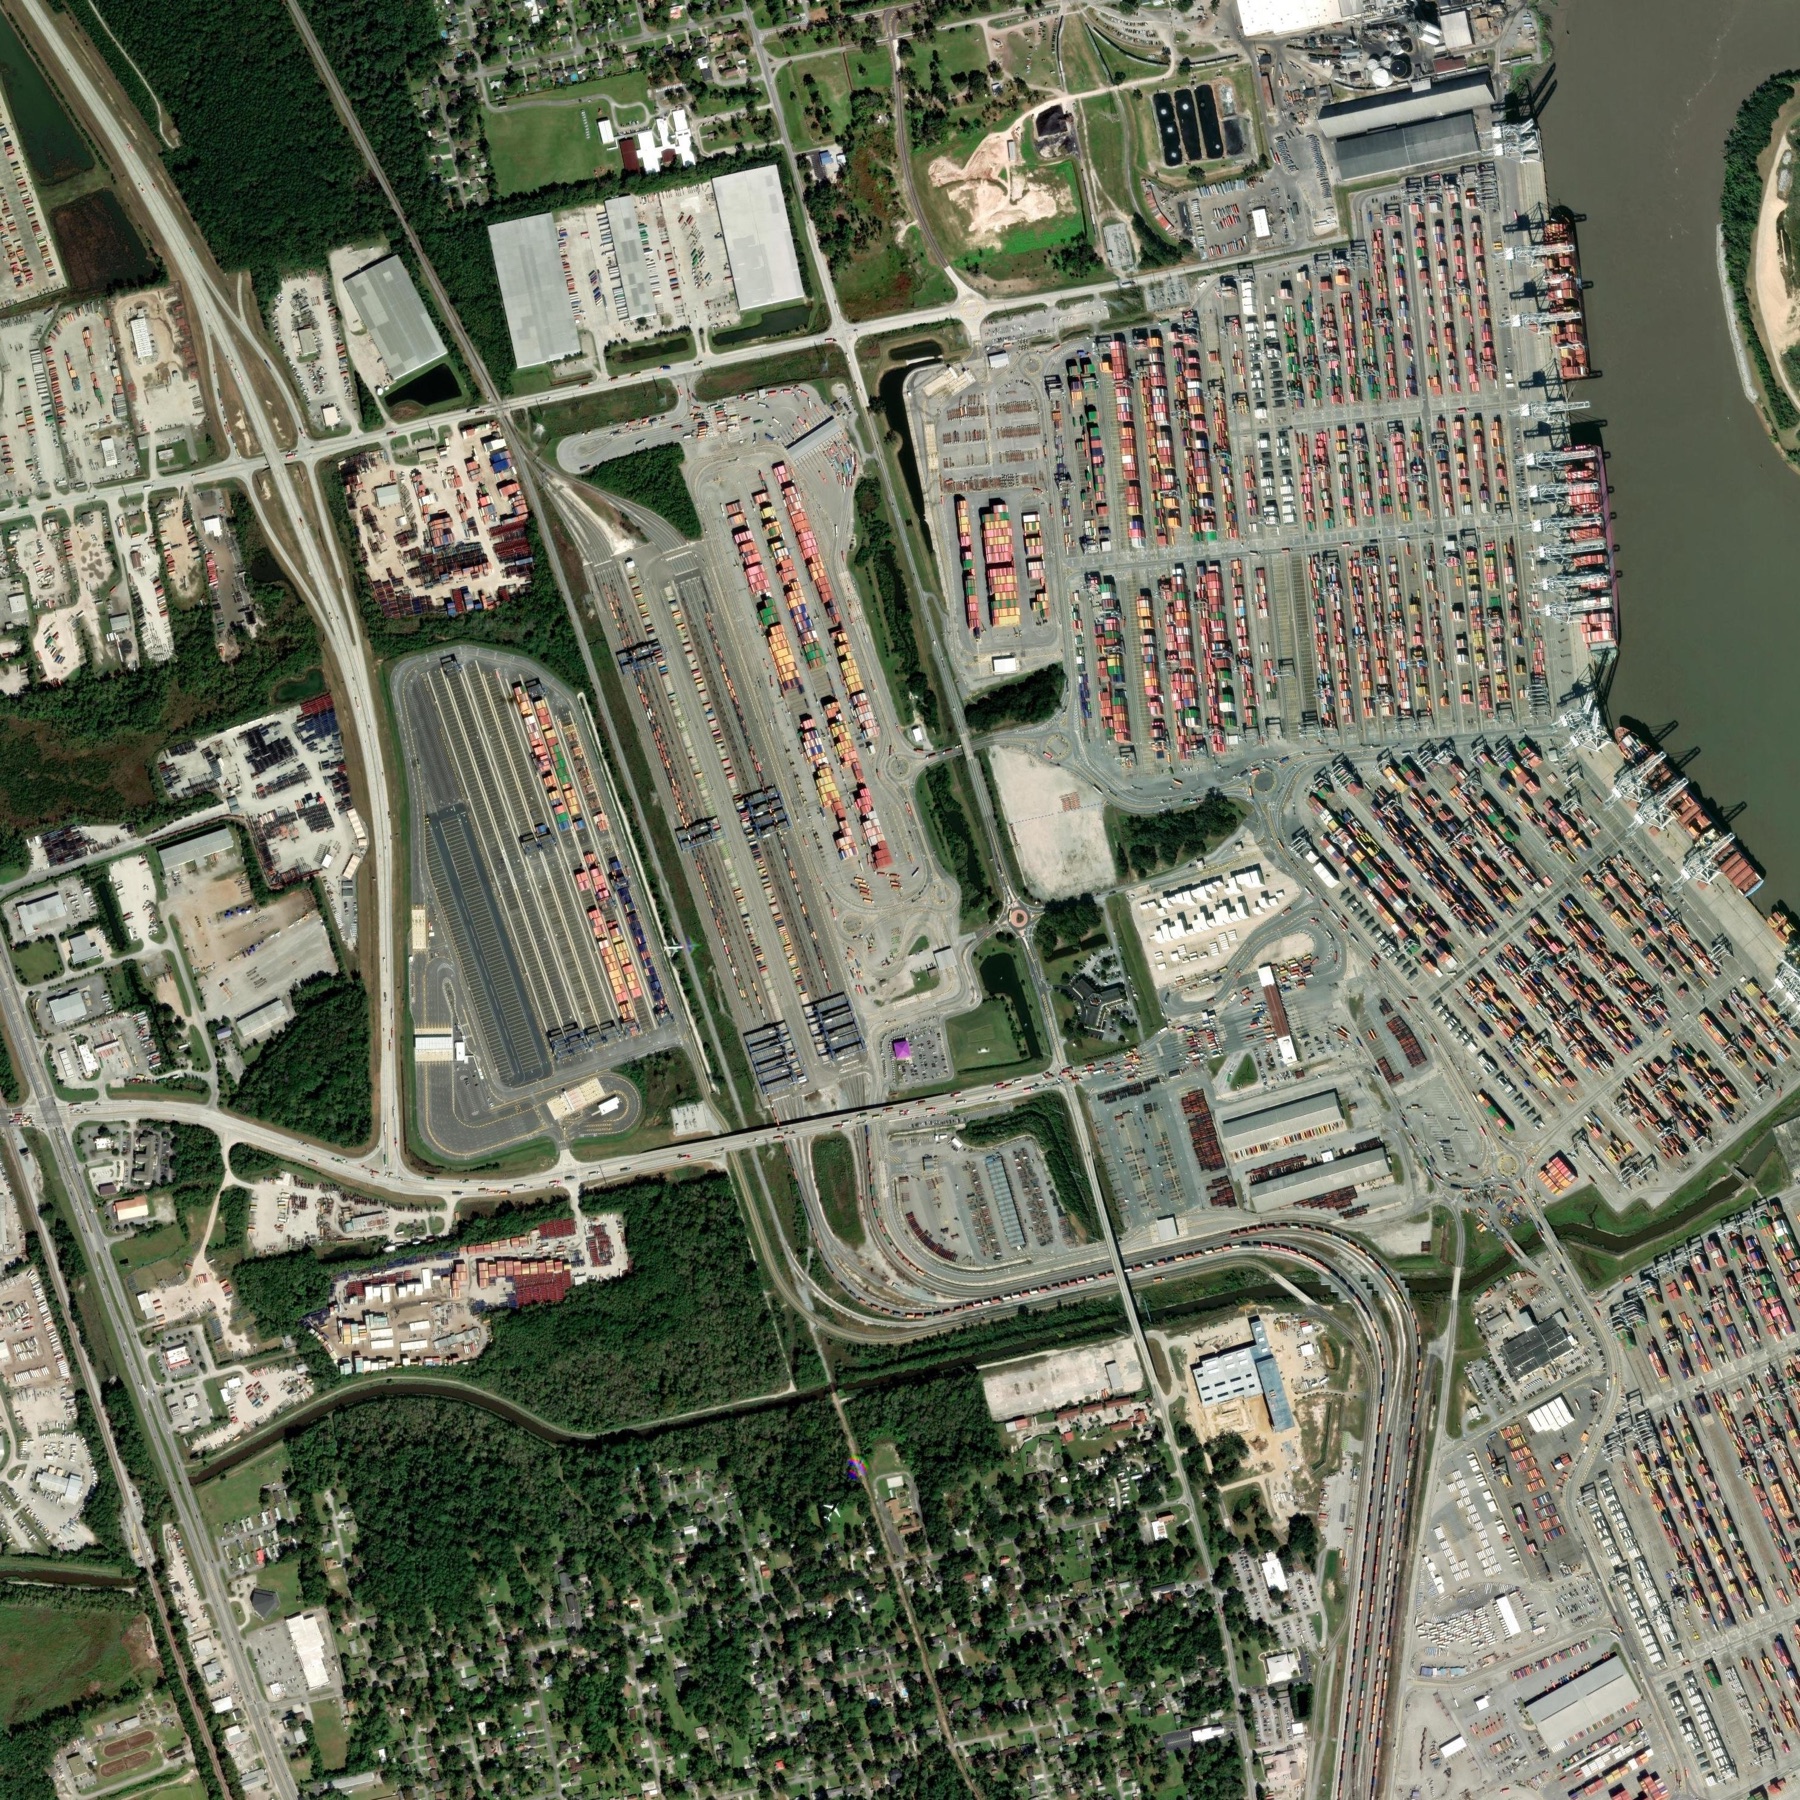
Start here: the Port of Savannah
This is one square mile of a working container port, just an aerial map with no satellite data on it yet. The tour adds five different satellites, one at a time, to see what each one reveals. Use Next to walk through them.
A 3 km × 3 km cut centered on Garden City Terminal, the busiest container yard at the Port of Savannah. Stacked container rows, gantry cranes, intermodal rail, and a slip on the Savannah River. The scene is the question: what does each sensor add at this resolution?